Kansas Democrats’ Covid Chart Masks the Truth
The state’s health secretary fudged the data to make the governor’s mask mandate look successful.
An old cliché is that Democrats govern with their hearts and Republicans with their heads. But Democrats this year are appealing to voters’ heads.
“Our ability to work together to solve big problems like a pandemic depends on a fidelity to facts and science and logic and not just making stuff up,” Barack Obama declared last week at the Democratic National Convention. The Bernie Sanders-Joe Biden unity platform asserts, “Democrats believe we must follow the informed advice of scientists and public health experts in addressing the coronavirus pandemic.” Democrats are trying to draw a contrast with President Trump, who often plays fast and loose with the truth.
But Democrats and their public health experts often manipulate data, and their dishonesty is more insidious because it gets a pass in the press. A case in point is a chart created by Kansas Democratic Gov. Laura Kelly’s Department of Health and Environment that purported to show her July 3 face-mask mandate has been a viral success.
The line graph includes two lines tracking the seven-day rolling average of cases per capita in the state—an orange one for the 15 counties that enforced the governor’s mandate and a blue one for the 90 counties that rejected it. The chart makes it appear as though cases in counties that followed the governor’s mandate plunged below cases in the counties that didn’t.
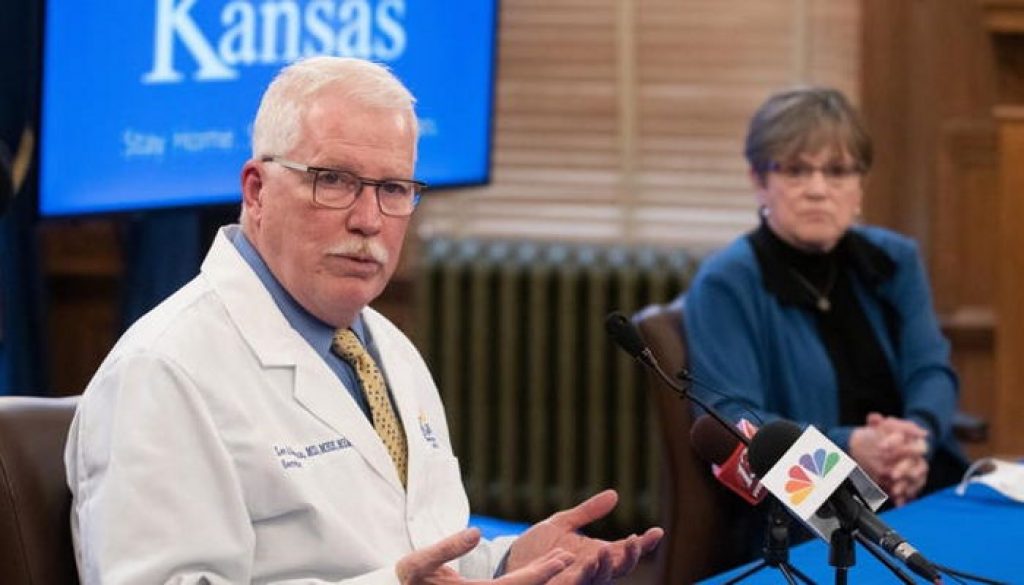
The group following the mask mandate “is winning the battle,” KDHE Secretary Lee Norman said. “All of the improvement in the case development comes from those counties wearing masks.” A reporter asked “if the no-mask counties would start masking,” would cases in their counties drop below the mask mandate counties? “I think it would,” he replied.
For starters, the two lines on the chart were plotted on two separate Y axes. Cases for counties that followed the mandate are on the left axis, with a range of 15 to 25, while those for counties that did not are on the right axis with a scale of four to 14. Even a 10-year-old would know better than to draw a graph with separate axes that compares the same trend.
Daily cases on Aug. 3—the last date on the chart—were in fact about 77% higher per capita in counties that followed the mask mandate. The Kansas Policy Institute, which filed an Open Records Act request for the names of counties and calculations used to produce the chart, created a more honest presentation of the data going back to June 22.


What the data show is that cases in all counties increased in the nine days after the governor imposed her mandate. This isn’t surprising since many people gathered with friends and family during the Fourth of July holiday.
But daily cases increased more in counties that adopted the governor’s mask mandate—from an average of 9 to 25 per 100,000—compared with those that did not—4 to 10 per 100,000. The percentage increase is similar in both groups, but counties that adopted the mask mandate should have experienced a smaller uptick if they were “winning the battle.”
There are many plausible explanations for this, including that unmasked counties were more rural and had a lower risk of spread. Many of their residents may have been wearing masks in public settings. Perhaps compliance was spotty in the more dense counties that adopted the mandate.
After being called out by the Kansas Policy Institute about his chart’s deceptions, Dr. Norman told reporters in Topeka: “I know that my graph was misunderstood and, in retrospect, I would redraw it different the next time” but “there’s no question the data is solid.”
McClatchy newspapers the Kansas City Star and Wichita Eagle on Aug. 16 ran a story with the headline: “Kansas began requiring masks, then virus cases dropped. Weeks later, ‘the data is solid.’ ” The story repeats Dr. Norman’s data distortions. Facts are stubborn things, but Democratic dogmatism is even more resolute.
Source: https://www.wsj.com/articles/kansas-democrats-covid-chart-masks-the-truth-11598483406


